Introducing ‘sound’ in data visualization
This case study investigates the design display of Data Sonification project developed by ArtSci Lab that introduces 'audio feedback' in Human-Technology Interactions. In the current state interactions we see little impact of audio in everyday interfaces, however, there is an increasing need for an efficient, non-visual means to convey information. Motivated by these needs, this work describes the development and evaluation of Sonification training modules which showcases the concept of sonification with a series of train-explore-test module phases.
Sonification is the use of non-speech audio to convey information. The expression, Sonification comes from the Latin syllable 'Sonus' which means sound.
Sonification broadens the field of human-computer interaction, with the addition of sound designers can exploit the auditory modality to answer complex problems in interaction design.
My role
I was interaction designer and primary researcher in the project. I worked in a team made of scientists, developers, designers, and researchers. One of my roles was to make these developed modules as a curriculum for graduate students for their data visualization’ course and also for undergraduate students for their interaction design’ course. I ran extensive usability studies with users on the sonification learnings tools and reported changes in the design of auditory displays.
I was cognitive scientist in the team. I designed experiments and steered the design process in accordance with the gathered results.
I conducted usability study to showcase the advantages of the auditory displays over traditional graphical displays. I worked along the data scientists to implement the changes and to improve the user experience of the application.
Application Use Cases
Sonification - The use of non-speech audio to communicate information or perceptualize data; it can be considered as an auditory analog to data visualization. Below example shows the sonification of carbon emission data collected over three decades by reseachers.
Sonification reflects our everyday experience with the world and the objects we interact with which make sounds. From the results of early research, it was evident users showed highly developed ear-brain systems which they used to decode the noises presented to them. With some training with sound characteristics, users would get better at understanding and perceiving sound as information. That's why Data Stethoscope introduces the concept of sonification with a series of train-explore-test sonification modules in a stepwise progression of complexity as a learning tool.
The developed sonification modules try to emulate everyday experiences with sound into human-computer Interaction which would make systems around us more efficient and familiar for users. The designed interactions perform data-to-sound mapping in real-time. Users are encouraged to explore ways to utilize sonification in conjunction with data visualization.
Auditory Display Design Process
Primary research was focused on the effectiveness of sound in the interfaces and how user’s perception works when sound is introduced as a datum. The gathered use cases of sound as output queue, then built into modules which got divided as per the modes of interaction.
Interactive Interaction - listener may passively take in a display without being given the option to actively manipulate the display. The display is simply triggered and plays in its entirety while the user listens.
Non-interactive Interaction - listener may be able to actively control the presentation of the sonification. In some instances, the user might be actively choosing and changing presentation parameters of the display
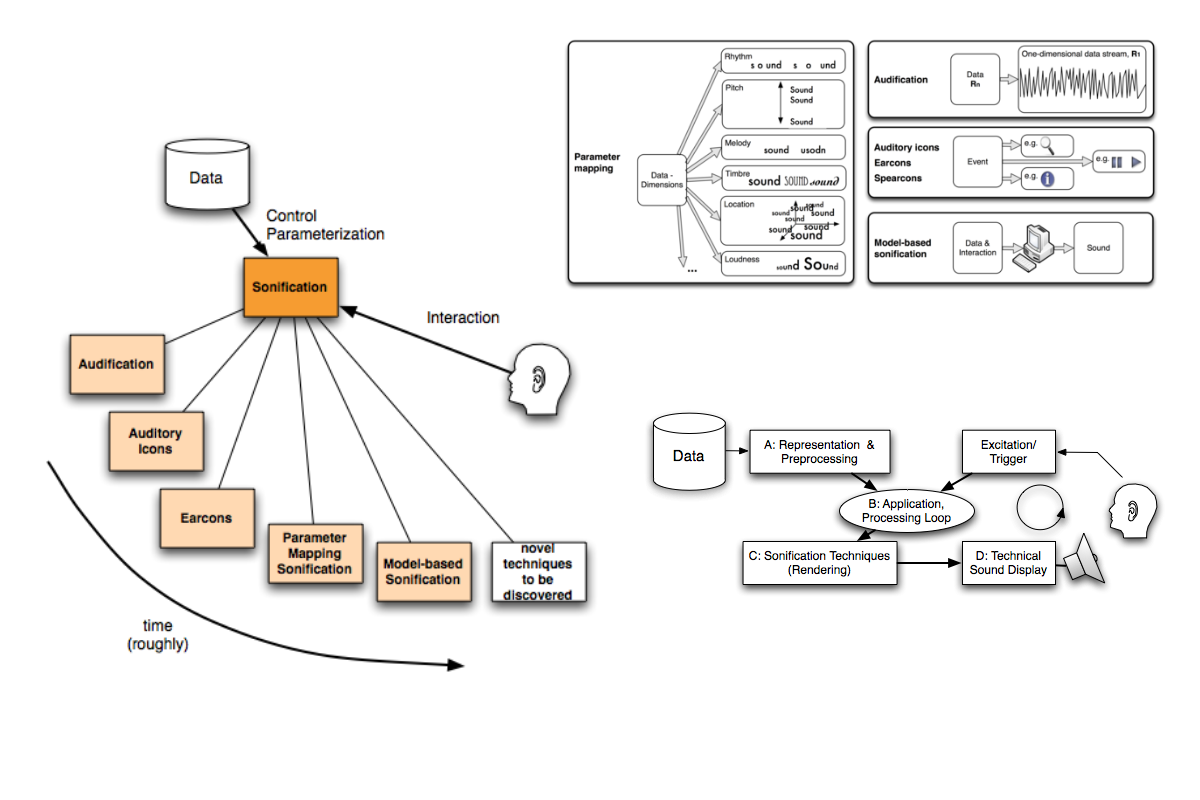
Sonification Approaches:
After classifying the mode of interactions next step was to narrow down the auditory design approach (mapping most effective sound dimension to the data set) for sonification modules.
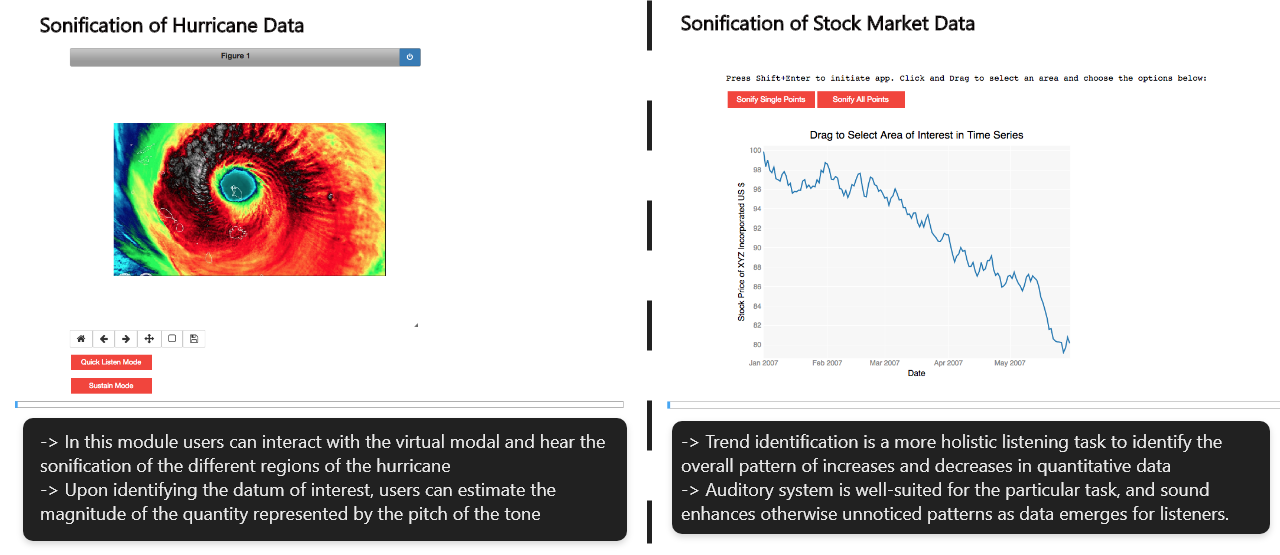
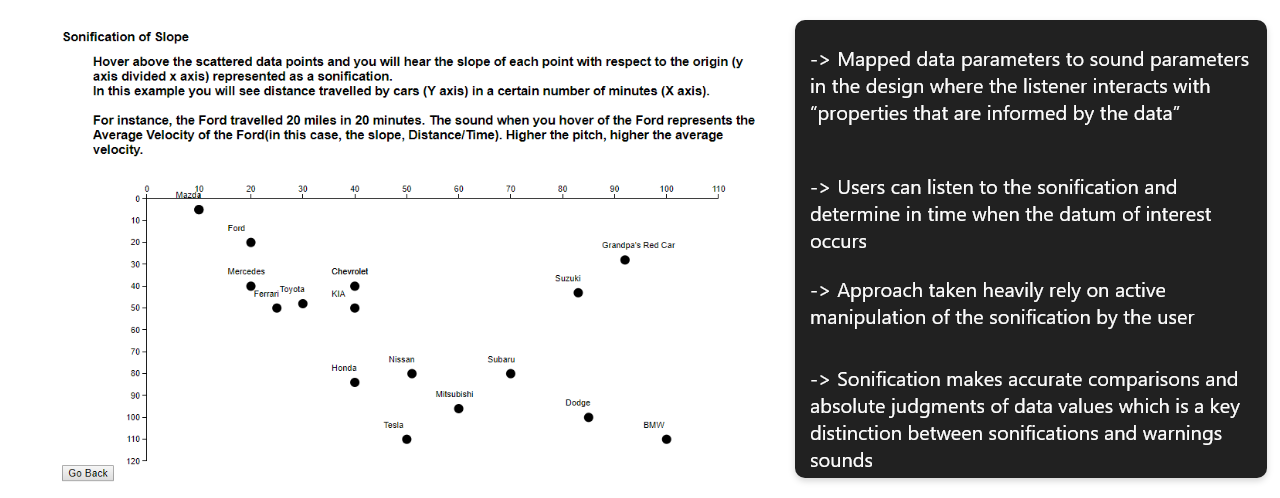
Model-based sonification modules:Auditory displays are made in a virtual model with which the listener interacts with the model’s properties. The interactions would inform users about the data. The output is perceived as ‘sound’ with the attached datum. After using the modules user comes to understand the structure of the data based on the acoustic responses of the model during the interactive probing of the virtual object.
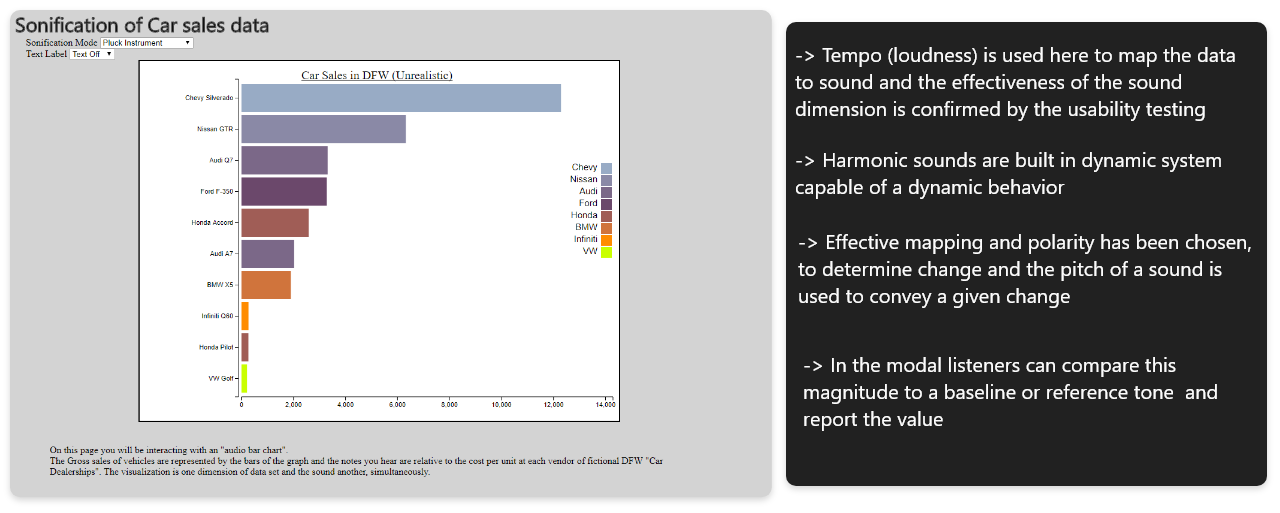
Event-based sonification modules:In these auditory displays, data and sound parameters are mapped is a way when users change data, acoustic properties connected with that data also changes. These modules produce a sonification which represents changes in data with changes in one or more sound attributes. These modules use a passive mode of interaction.
Behavioral Needs and Pain Points
- More common uses of sonification in our daily lives are alarms, alerts, and warning focused applications but instead of going that route we tried to do something more with the sonification.
- With point estimation modules accurate extraction of a specific value was impossible but users showed dramatic improvements when got trained and estimated the near to exact data values.
- Usability test also confirmed data which is generally slow-changing with relatively few inflection points (e.g., weather data) are best represented with a different type of auditory display than data that is rapidly-changing with many directional changes (e.g., Gross Sales).
- The Point estimation modules are presented visually in a graphical format as it would be in scientific and popular publications. By implementing the data like this extraction of information of a single datum became intuitive for users.
- It is important to perceptually separate the different type of data. A visual graph without context cues (e.g., no axes or tick marks) provided no way to estimate the value at any point.
Strengths and Limitations
I tested these modules internally to get holistic feedback on the functional modules. I designed the tests and experiments to find out the accuracy and limiting factors within modules. Results pointed out the perceptual and information processing capabilities of the human listener.
Human listeners showed excellent accuracy in judging the pitch of the sound when presented. Results showed users made more errors with a graphical interface with an accuracy of 77% but with auditory displays, the accuracy increased to 95% for attention task for single stimuli.
Testing revealed human limitations and natural biases towards analyzing data through sound.
- Musicality: The use of musical sounds showed a lot of effectiveness because of the ease with which musical sounds are perceived.
- Individual differences and training: The differences in training and experience with developed sonification modules affected perfor¬mance with the auditory displays.
- Cognitive abilities of the listener: Cognitive abilities had a huge influence in the comprehension of visual displays, including spatial abilities, domain or content knowledge and graph-reading skill, and working memory.
Future of 'Data Stethoscope'
Developed modules are made to be treated as guidance until repeated measurements and continued application experience converge toward a clear value or range as a learning tool. As the targeted users and many of us learned how to read the statistical data in school, similar to this sonification also needs time and training. Our plan is to make a data visualization tool in the platform like tableau where users can implement auditory displays in their work.
Nevertheless, there remains a paucity of research aimed at studying the factors within a data set that can affect perception or comprehension and to which length these are dependent on cognitive skills of the user.
Future research will show set characteristics of data such as density and pressure which are widely used in the medical practice and what would be the best choice to map them to sound?
Even with using all the sophisticated sonification methods, we trimmed the data sets and reduced its dimensionality to decrease volatility before applying suitable sonification. In the research, it was evident that smaller and simpler data sets are more comprehensible through auditory graphs and auditory histograms.
Addition of sound in basic traditionally visual interface operations enhanced the performance of the tasks and this would be the theme for future auditory displays.
Future work would also focus on the semiotics of sound how acoustic perception takes on conceptual representation?